Allied Energy Corporation (AGYP) closed last week on a high note for the second time in September. Friday, AGYP closed up 18.64%, closing at $0.385 trading 837,000 shares.
Looking at several factors in my research there is reason to believe this week could close on an even higher note, and that action could start this morning.
To start, looking at the OTC Short Report the last 3 sessions has seen AGYP shorts come back in full strength. Over 60% of AGYP’s volume has been short in each of the last 3 trading days. However, the percentage has decreased every day, and judging by Friday’s big move these shorts will need to cover.

One reason this squeeze may start in full force on Monday is the number of indicators pointing in the right direction.
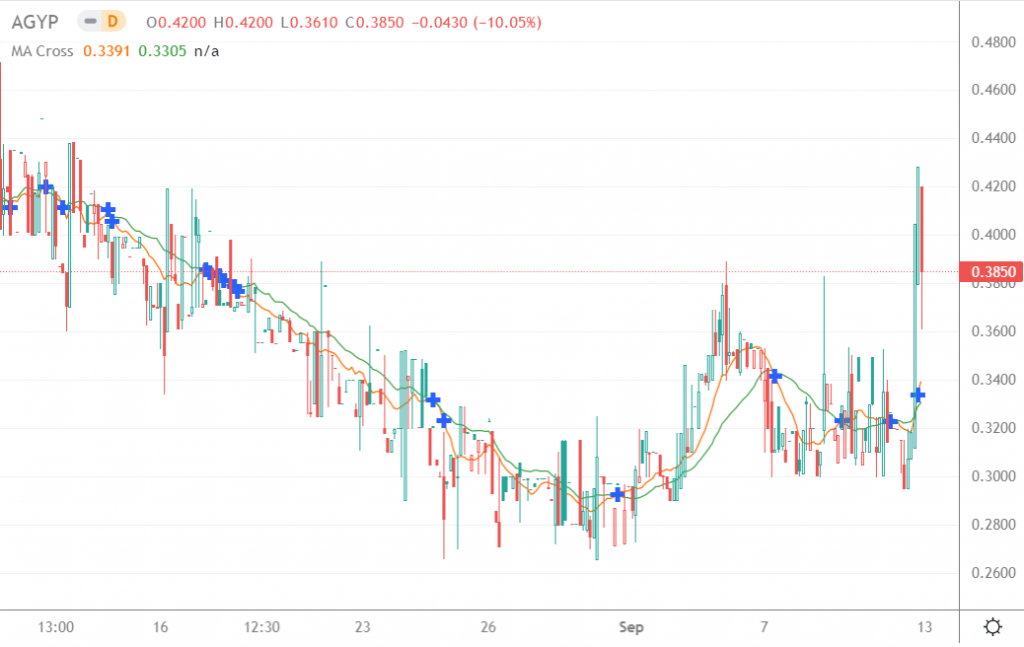
One of the most-watched MA pairs is the 12 and 26 day; as you can see in the chart below the 12 day has crossed the 26 which is a major bullish signal for short-term traders.

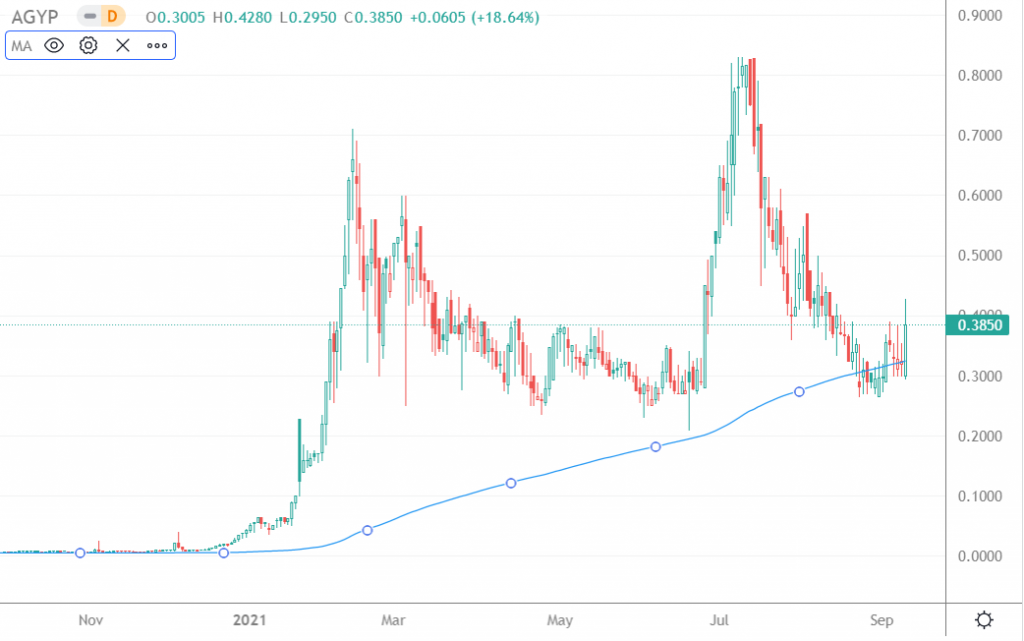
Long-term investors tend to watch the 200 day MA, and as you can see from this 1-year chart plotting the 200 day MA the stock crossed the average to the bullish side yesterday which certainly hit the scanners this weekend. This could be a sign that more longs will come in this week.

Seeking Alpha has a handy Technical Analysis Indicator which basically distills short, medium, and long indications into a 12 tiered indicator. AGYP is a BUY on a majority of these indicators.

Finally, according to another major technical analysis site Barchart, AGYP is rated as a BUY. Here is a list of all of the indicators AGYP is rated on BUY on:
20 Day Moving Average
200 Day Moving Average
20-200 Day MACD Oscillator
50-100 Day MACD Oscillator
50-150 Day MACD Oscillator
50-200 Day MACD Oscillator
100-200 Day MACD Oscillator
So, as you can see, AGYP is looking set up for a bullish move this week, with so many indicators pointing in the right direction and the shorts looking to be caught in a very bad situation which could create a squeeze; you should make sure AGYP is on your watchlist right now.
