Allied Energy Corporation (OTCMKTS:AGYP) has had a record year on the market. The stock has been up over 1,500% and maintains 500% share price appreciation so far in 2021. While this can be attributed to many factors including a record year for oil, the company’s monster announcement about their leases’ resources and progress made at said leases; that’s not why we are writing about the company today.
Today is all about the chart, and AGYP’s looks fantastic for both short and long-term investors. According to Seeking Alpha’s handy technical analysis summary, the stock is a buy in both the extremely short and long term as you’ll see pictured on the chart below.
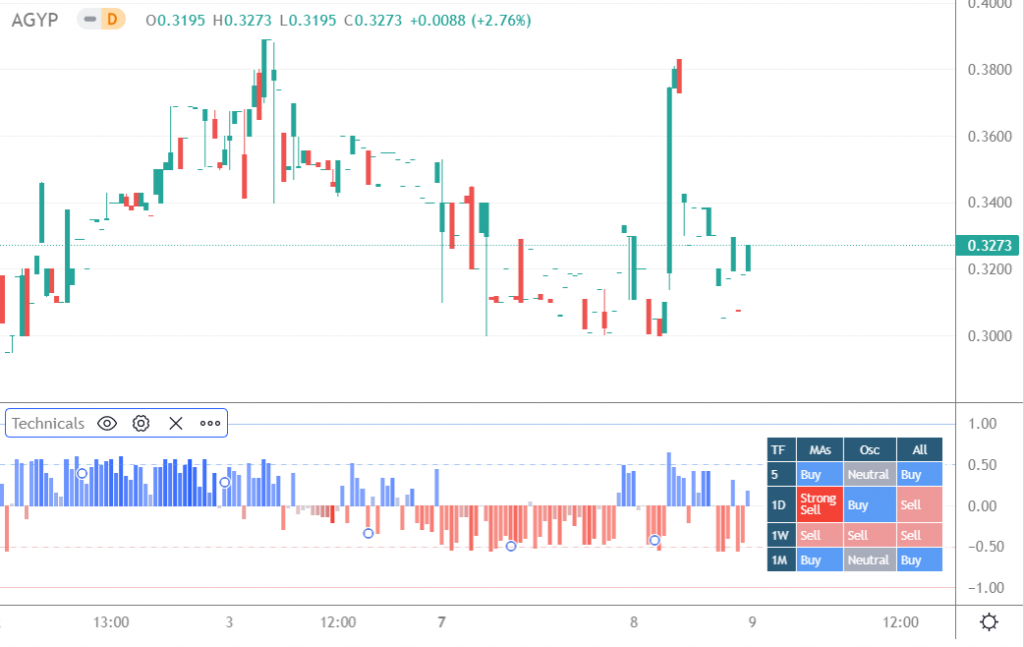
While that tool is great, let’s dig into exactly what indicators AGYP is hitting and why you should care.
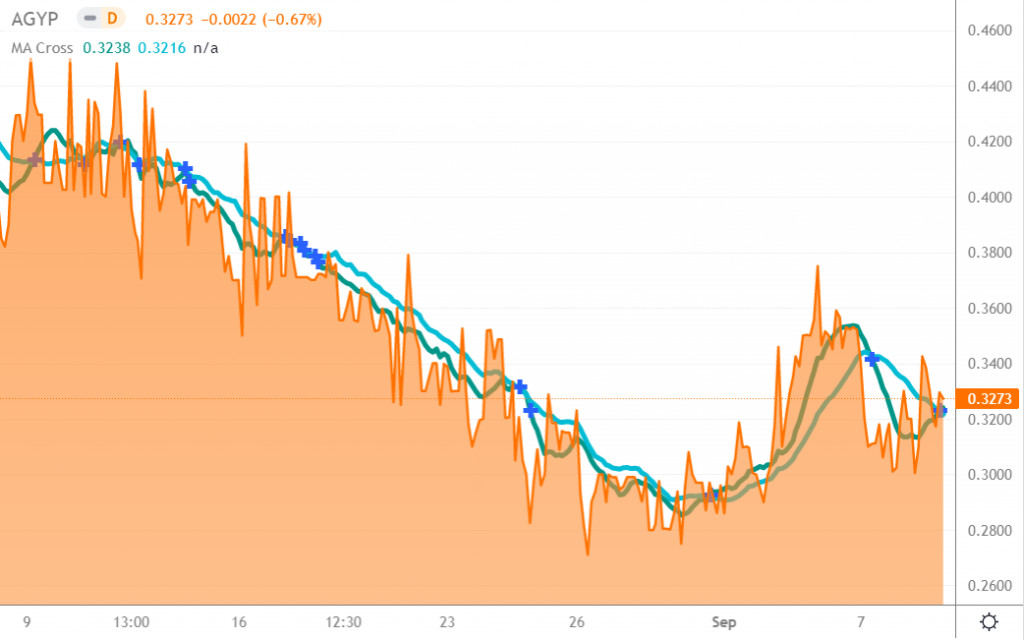
One of the most widely used technical indicators among short-term traders is the 12-26 day Moving Averages, as you’ll see in the chart below, AGYP’s 12 day has just crossed the 26 day, this is a major bullish indicator. Day traders across the world have scans set to find stocks making this cross as it is generally a buy signal.
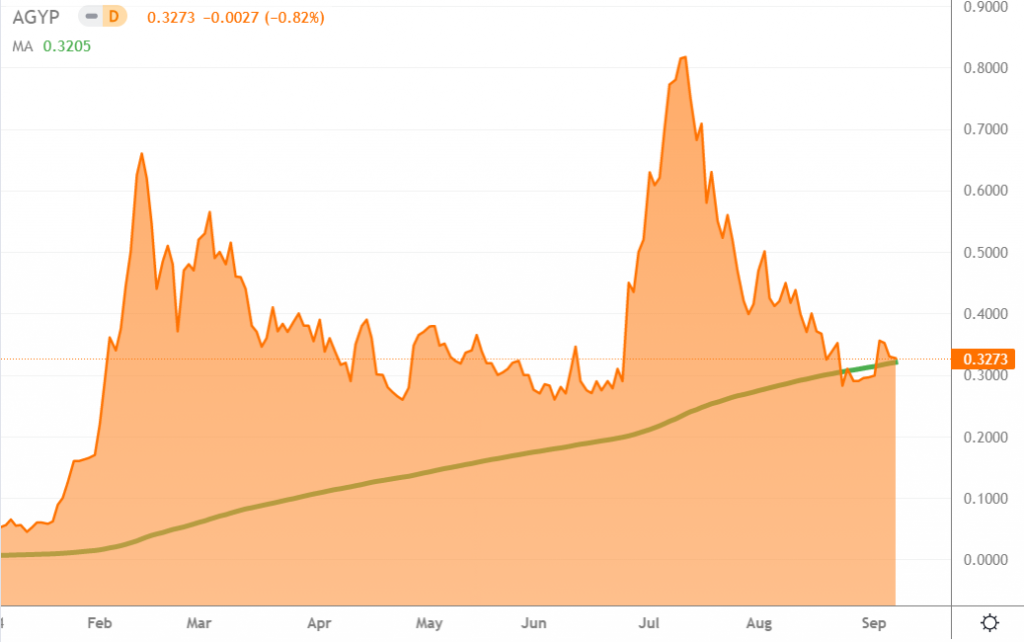
Long-term traders use the 200-day Moving Average to discover buying opportunities on stocks they like and or just to discover new stocks they may want to enter. Currently, AGYP rests right on top of the 200 day for the first time this year (pictured below), this is generally a spot where long-term investors bullish on the company will begin to accumulate and new investors learning about the stock will see as a buying opportunity.
Finally, a great confirmation indicator for both long and short-term investors is the Relative Strength Index “RSI”, which shows if a stock is overbought or oversold. The lower the number the more likely it is oversold or undervalued, meaning a low number on the RSI will, in conjunction with other positive indicators like the two we mentioned above, indicate a buying opportunity.
Here’s AGYP’s RSI:
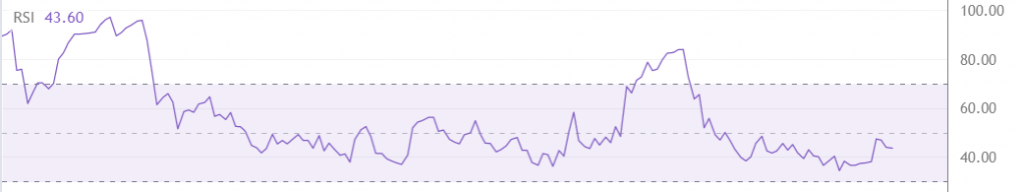
At 43.6 below 50, AGYP is certainly in buy range.
While technical analysis only tells part of the story, we have detailed on this blog several reasons fundamentally why Allied Energy Corp is experiencing a record year.
For many traders, however, technical analysis is all they look at. If these traders see AGYP on their scans today, which is very likely considering all the boxes the chart is proverbially checking, the company could see some action to close the week on a high note, much like it did a week ago when it gained 20% before the long weekend.
AGYP has been heavily shorted, and this action could trigger a squeeze.
Make sure AGYP is on your radar this morning.